Website Performance - What is it, how to measure it and how to improve it
Website performance isn’t just about loading speed - it’s about the entire experience users have while interacting with your site. In a world where people expect fast, smooth, and seamless web experiences, performance can be the difference between retaining customers or losing them. In this post, we’ll break down what website performance is, how to measure it, and key ways to improve it.
What is website performance?
Website performance encompasses several factors that impact the user experience, including:
Loading Speed: How quickly the website displays content.
Interactivity: How responsive the website is when a user interacts with it (e.g., clicking a button, submitting a form).
Page Stability: Ensuring content doesn’t shift unexpectedly as the page loads.
Server Health: The ability of the server to respond quickly to all customers requests
What are the benefits of good performance?
User Experience and Engagement: Increased retention, repeat visits, lower bounce rates and increased time on site.
Brand Perception: Positive impact on customer satisfaction, and overall brand reputation.
Conversion & Revenue: Increased conversion rates, lower cart abandonment and ultimately increased sales.
SEO (Search Engine Optimisation): Strong Core Web Vitals can positively impact search engine rankings.
What impacts website performance?
Website performance can be affected by several factors:
Resources: Images, javascript, data, content from GTM, third-party scripts, marketing overrides, content changes.
Network Speed: The rate at which files and data are transmitted and received.
Caching: Caching data in the browser or on the server can improve load times.
Quality of Code: Well-optimized code ensures the site runs efficiently.
How do you measure performance?
When measuring website performance, there are two main approaches:
Synthetic testing
This method simulates real customer interactions under controlled conditions, either in test environments or on a live site.
Common tools that we use for synthetic testing are:
Lighthouse
WebPageTest
PageSpeed Insights
Real User Metrics (RUM)
These metrics are gathered from actual users interacting with the site in a production environment. They provide more accurate data on real-world performance.
Common tools that we use to collect real user metrics are:
FullStory
Sentry
LogRocket
NewRelic
CrUX (Chrome User Experience Report)
What should you measure?
When it comes to measuring website performance, here are the key metrics to focus on.
Core Web Vitals
Created by Google, these metrics aim to measure real-world user experience for loading performance:
LCP (Largest Contentful Paint) - Measures how quickly the largest piece of content on the page loads.
INP (Interaction to Next Paint) - Tracks how long a user needs to wait for the next thing to happen after they’ve clicked on something (e.g. opening a menu).
CLS (Cumulative Layout Shift) - Measures the amount of unexpected shifting of content on a page.
Other Web Vitals
Also created by Google, these metrics are not considered Core Web Vitals, but continue to be useful for measuring performance improvements:
TTFB (Time to First Byte) - Measures how quickly the first bit of data is received after a user’s request.
TBT (Total Blocking Time) - Indicates how long a page remains unresponsive over a period of time.
Custom User Journeys / Metrics
These are specific interactions that you wish to track, which aren’t collected by default, such as:
Transition times between pages (especially helpful on Single Page Applications).
Time taken for a content to display category to be shown after clicking a menu item.
Time taken to “Load More” on a product listing page.
Time taken for search results to be displayed after typing a search term.
Server Performance
Proportion of requests served from cache.
Average response times.
Response times for specific key queries.
What is the process for improvement?
To improve your website’s performance, follow this process:
1. Identify
The first step is pinpointing specific areas for improvement, which can be achieved by considering these key factors:
User friction - Identify interactions where poor performance frustrates users. Customer funnel reports can highlight drop-off points.
Underperforming Metrics – Compare key performance metrics against benchmarks. Lighthouse tests can provide insights into how your site stacks up against competitors.
2. Prioritise
Negative Experience: Prioritise areas where performance issues cause the most frustration, like long load times or sluggish interactivity
Effort vs. Impact: Identify quick wins that require minimal effort but provide significant performance boosts. Technical investigation can help identify low-hanging fruit.
Critical User Journeys: Focus on improving the performance of the key actions users take on your site, like completing a purchase or filling out a contact form.
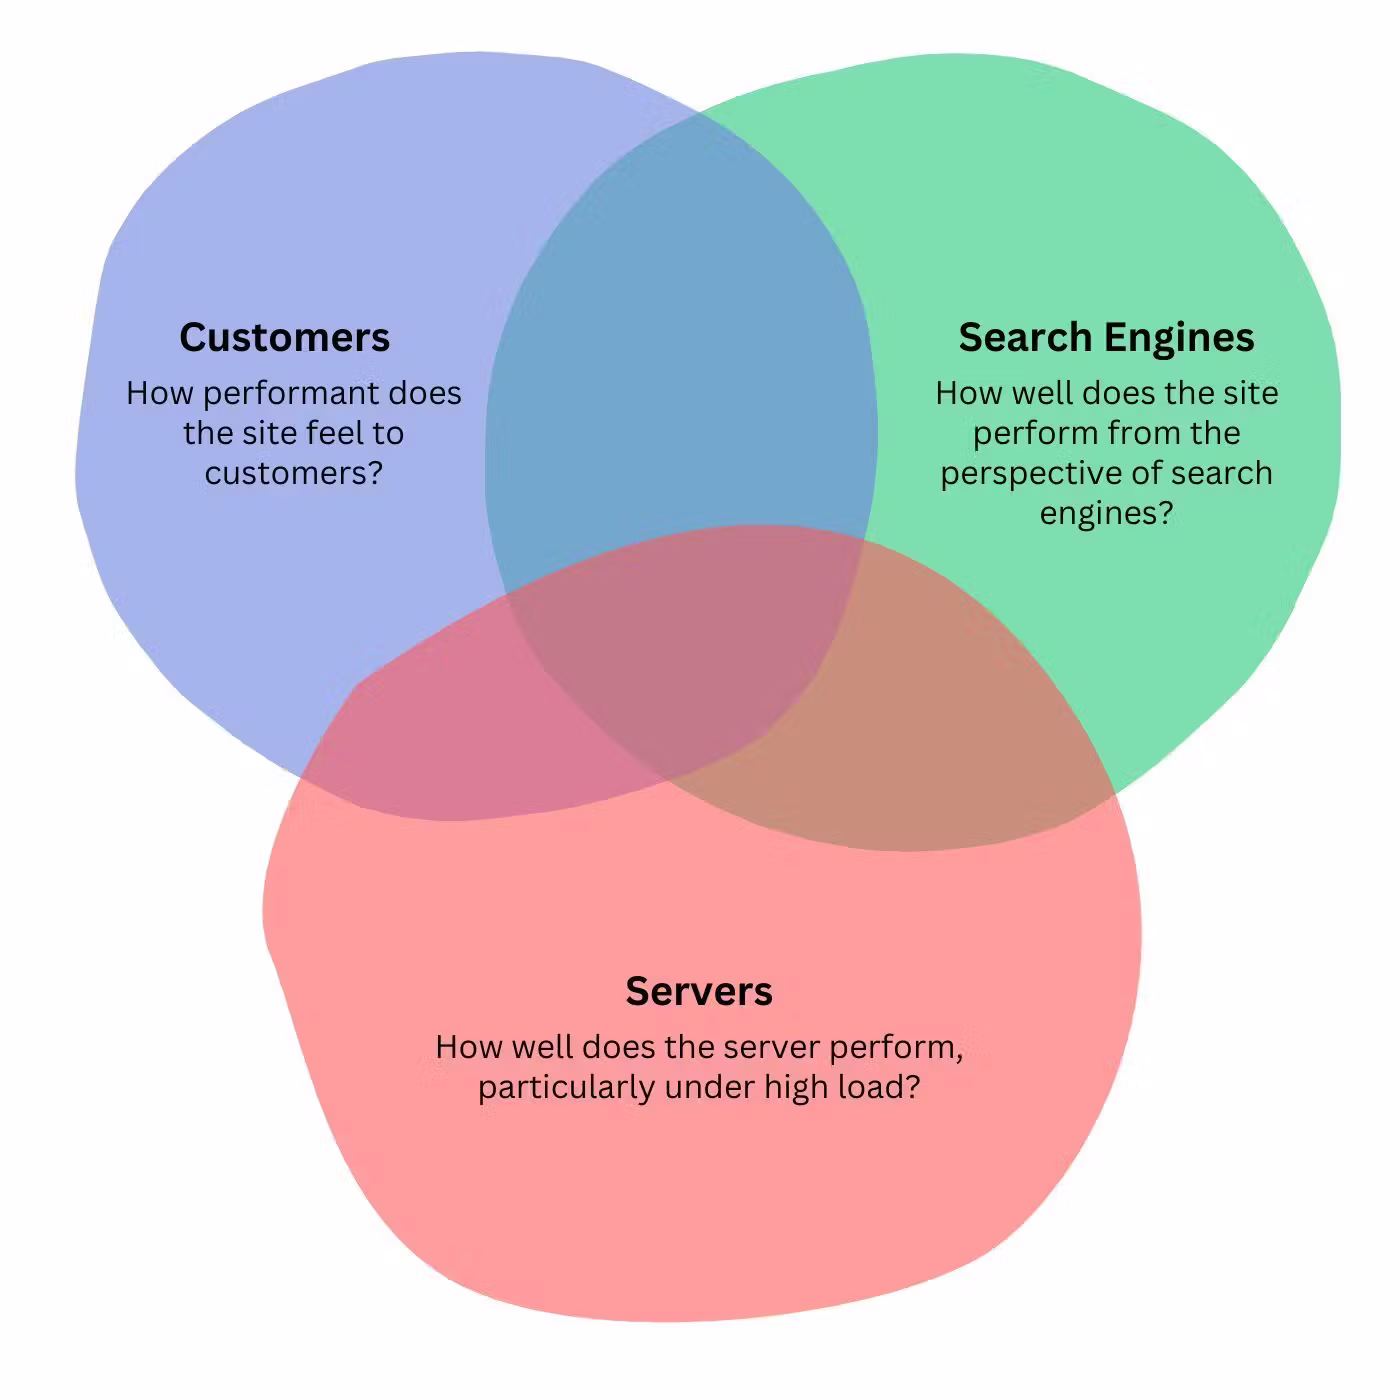
Categorise: Categorising areas can help with prioritising, especially if you have specific goals in mind. 3 categories that are important to most websites are “Customers”, “Search Engines” and “Servers” as shown in the diagram below. Some areas might fall into multiple categories.
3. Measure
Determine how performance in the focus areas can be measured prior to making any changes, as well as after. Utilise existing measurements such as Core Web Vitals, or if no relevant metric currently exists, consider adding a custom metric.
4. Implement changes
Address issues through code optimisations, caching improvements, configuration adjustments or reducing the number of resources loaded by the site.
5. Validate changes
Test updates in a controlled environment first, then use real-user data to verify if the changes have had the desired effect.
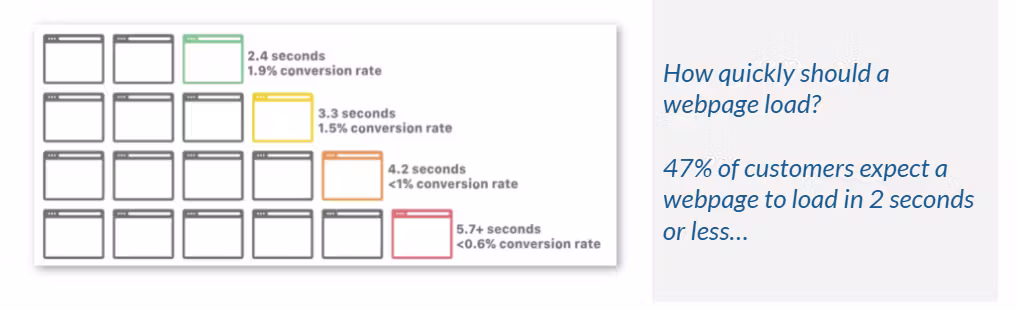
Impact of Site Speed on Conversions
Improving site speed is a critical factor in improving conversion rates. Numerous studies have demonstrated a direct correlation between site performance and customer engagement, making it an essential aspect of website design. Reference: cloudflare.com
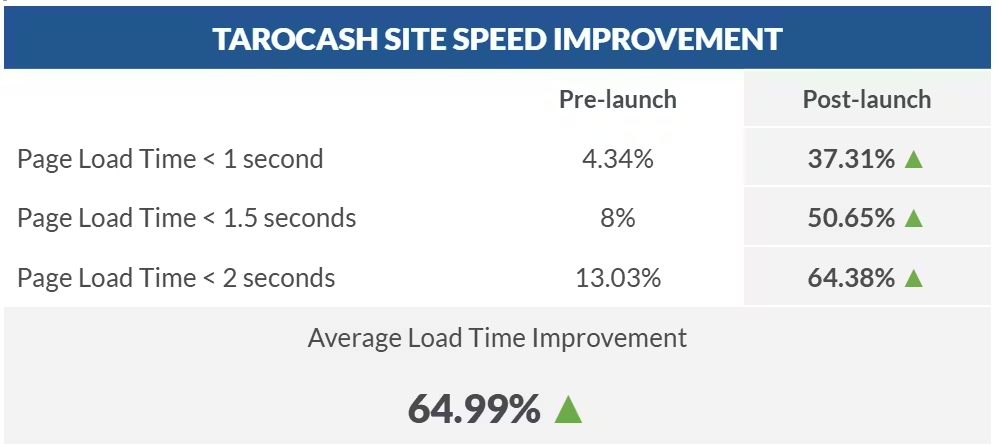
The Aligent Take Flight Architecture helped improve the site speed for one of our clients, Tarocash.
3. Measure
Determine how performance in the focus areas can be measured prior to making any changes, as well as after. Utilise existing measurements such as Core Web Vitals, or if no relevant metric currently exists, consider adding a custom metric.
4. Implement changes
Address issues through code optimisations, caching improvements, configuration adjustments or reducing the number of resources loaded by the site.
5. Validate changes
Test updates in a controlled environment first, then use real-user data to verify if the changes have had the desired effect.
Impact of Site Speed on Conversions
Improving site speed is a critical factor in improving conversion rates. Numerous studies have demonstrated a direct correlation between site performance and customer engagement, making it an essential aspect of website design. Reference: cloudflare.com